
Data Flow Diagram (DFD)s: An Agile Introduction
- Squares representing external entities, which are sources or destinations of data.
- Rounded rectangles representing processes, which take data as input, do something to it, and output it.
- Arrows representing the data flows, which can either be electronic data or physical items.
- Open-ended rectangles representing data stores, including electronic stores such as databases or XML files and physical stores such as or filing cabinets or stacks of paper.
Figure 1. Enrolling in the university.
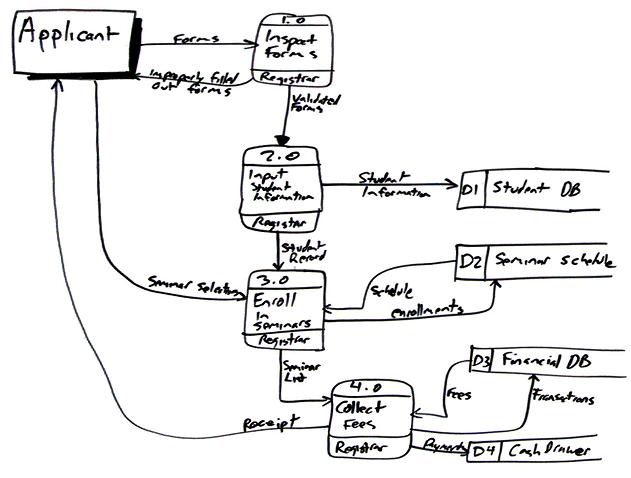
To create the diagram I simply worked through a usage scenario, in this case the use case logic described in the Enroll in University system use case. On actual projects it’s far more common just to stand at a whiteboard with one or more stakeholders and simply sketch as we talk through a problem.
In this case I started with the applicant, the external entity in the top left corner, and simply followed the flow of data throughout the system. I introduced the Inspect Forms process to encapsulate the initial validation steps. I assigned this process identifier 1.0, indicating that it’s the first process one the top level diagram. A common technique with DFDs is to create detailed diagrams for each process to depict more granular levels of processing. Were I to do this for this process I would number the subprocesses 1.1, 1.2, and so on. Subprocesses of 1.1 would be numbered 1.1.1, 1.1.2, and so on. I wouldn’t bother to expand this process to more detailed DFD as it is fairly clear what is happening in it and therefore the new diagram wouldn’t add any value. I also indicated who/what does the work in the bottom section of the process bubble, in this case the registrar. This information is optional although very useful in my experience. You can see how the improperly filled out forms are returned to the applicant if required.
I then continued to follow the logic of the use case, concentrating on how the data is processed by each step. The second process encapsulates the logic for creating a student record, including the act of checking to see it the person is eligible to enroll as well as if they’re already in the database. Notice how each data flow on the diagram has been labeled. Also notice that the names of the data change to reflect how it’s been processed.
Now that I look closer at the diagram the arrow between the Input Student Information process and the Student DB data store should be two-way because this process searches the database for existing student records. Unfortunately I’ve erased this diagram from my whiteboard so it isn’t easy to address this minor problem. Yes, I could use a drawing program to update the arrowhead but its more important to make the point that agile models don’t need to be perfect, they just need to be good enough. AM recommends that you follow the practice Update Models Only When it Hurts and in this case this issue doesn’t hurt enough to invest the two or three minutes it would take to fix the diagram.
The Collect Fees process is interesting because it interacts with an electronic data store, Financial DB, as well as a physical one, Cash Drawer. DFDs can be used to model processes that are purely physical, purely electronic, or more commonly a mix of both. Electronic data stores can be modeled via data models, particularly if they represent a relational database. Physical data stores are typically self explanatory.
There are several common modeling rules that I follow when creating DFDs:
- All processes must have at least one data flow in and one data flow out.
- All processes should modify the incoming data, producing new forms of outgoing data.
- Each data store must be involved with at least one data flow.
- Each external entity must be involved with at least one data flow.
- A data flow must be attached to at least one process.
Although many traditional methods have a tendency to apply DFDs in dysfunctional ways it is still possible to do so in an agile manner as well. Keep your diagrams small, as I did above. Use simple tools, such as whiteboards, to create them with your stakeholders. Travel light and erase them when you’re through with them. Create them if they’re going to add value, not simply because your process tells you to do so. The bottom line is that some of the modeling methodologies may have been flawed but the need to represent the data flow within a system is still required.
Source
This artifact description is excerpted from Chapter 9 of The Object Primer 3rd Edition: Agile Model Driven Development with UML 2.